fishbone diagram (Ishikawa cause and effect)

A fishbone diagram is a visualization tool for categorizing the potential causes of a problem. This tool is used in order to identify a problem’s root causes. Typically used for root cause analysis, a fishbone diagram combines the practice of brainstorming with a type of mind map template. It should be efficient as a test case technique to determine cause and effect.
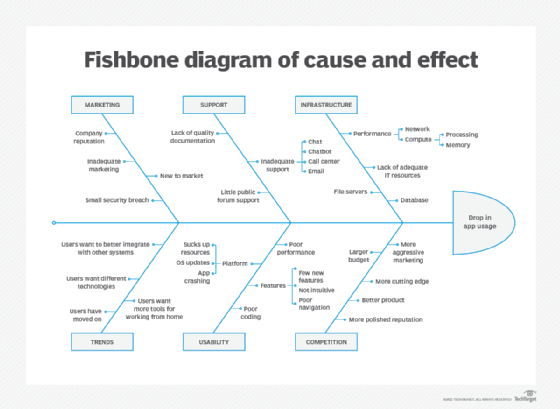
A fishbone diagram is useful in product development and troubleshooting processes, typically used to focus a conversation around a problem. After the group has brainstormed all the possible causes for a problem, the facilitator helps the group to rate the potential causes according to their level of importance and diagram a hierarchy. The name comes from the diagram's design, which looks much like a skeleton of a fish. Fishbone diagrams are typically worked right to left, with each large "bone" of the fish branching out to include smaller bones, each containing more detail.
Dr. Kaoru Ishikawa, a Japanese quality control expert, is credited with inventing the fishbone diagram to help employees avoid solutions that merely address the symptoms of a much larger problem. Fishbone diagrams are considered one of seven basic quality tools and are used in the "analyze" phase of Six Sigma's DMAIC (define, measure, analyze, improve, control) approach to problem-solving.
Fishbone diagrams are also called a cause and effect diagram, or Ishikawa diagram.
How to create a fishbone diagram
Fishbone diagrams are typically made during a team meeting and drawn on a flipchart or whiteboard. Once a problem that needs to be studied further is identified, teams can take the following steps to create the diagram:
- The head of the fish is created by listing the problem in a statement format and drawing a box around it. A horizontal arrow is then drawn across the page with an arrow pointing to the head. This acts as the backbone of the fish.
- Then at least four overarching "causes" are identified that might contribute to the problem. Some generic categories to start with may include methods, skills, equipment, people, materials, environment or measurements. These causes are then drawn to branch off from the spine with arrows, making the first bones of the fish.
- For each overarching cause, team members should brainstorm any supporting information that may contribute to it. This typically involves some sort of questioning methods, such as the 5 Why's or the 4P's (Policies, Procedures, People and Plant) to keep the conversation focused. These contributing factors are written down to branch off their corresponding cause.
- This process of breaking down each cause is continued until the root causes of the problem have been identified. The team then analyzes the diagram until an outcome and next steps are agreed upon.
Example of a fishbone diagram
The following graphic is an example of a fishbone diagram with the problem "Website went down." Two of the overarching causes have been identified as "Unable to connect to server" and "DNS lookup problem," with further contributing factors branching off.
When to use a fishbone diagram
A few reasons a team might want to consider using a fishbone diagram are:
- To identify the possible causes of a problem.
- To help develop a product that addresses issues within current market offerings.
- To reveal bottlenecks or areas of weakness in a business process.
- To avoid reoccurring issues or employee burnout.
- To ensure that any corrective actions put into place will resolve the issue.