qualitative data
What is qualitative data?
Qualitative data is information that cannot be counted, measured or easily expressed using numbers. It is collected from text, audio and images and shared through data visualization tools, such as word clouds, timelines, graph databases, concept maps and infographics.
Qualitative data analysis tries to answer questions about what actions people take and what motivates them to take those actions. Collecting and working with this kind of data can be time-consuming, because it requires reflection on the part of the analyst. Someone who works with qualitative data is called a qualitative researcher or qualitative analyst.
Qualitative data analytics (QDA) software is used in many research fields, including healthcare, as well as business and marketing. In statistics, qualitative data is known as categorical data.
Qualitative vs. quantitative data
Quantitative data is always numerical. It can be put in a database and analyzed using mathematical and statistical methodologies. Typically, quantitative data is structured, while qualitative data is unstructured.
The information gained from performing both quantitative and qualitative data analysis can be complementary, but the goals for examining each type of data and the tools required to gain insight from each are different.
A quantitative data analyst seeks to answer objective questions about an event. In contrast, a qualitative researcher would seek to answer subjective questions about the meaning people assigned to the same event.
Types of qualitative data
Unstructured qualitative data is typically talked about in terms of two types: ethnographic and interpretive. Ethnographic data is collected to understand how a group assigns context for an event. Interpretive data is collected to understand an individual's personal experience and feelings about the event.
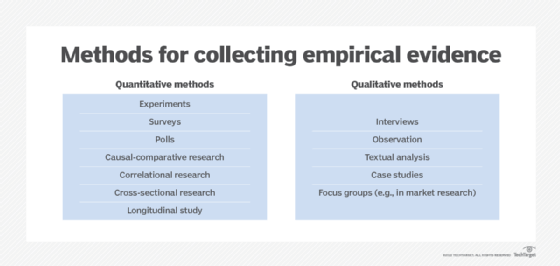
Qualitative data collection methods
Qualitative data is often collected through direct or indirect observation, or by asking open-ended questions. Popular collection methodologies include the following:
- Interviews.
- Focus groups.
- Open-ended survey questions.
- Fieldwork.
- Pulling from existing records.
- Participant observation.
- case studies.
- Cultural, or ethnographic, research.
Examples of qualitative data
A quantitative research marketer might try to understand customer behavior by looking at what a specific customer bought, when they made the purchase, where they made the purchase and how much they paid.
In contrast, a qualitative researcher might seek to understand the same customer's behavior by looking at who the customer is in terms of the entire population, how they researched their purchase and why they made the decision to purchase one brand over the other.
Qualitative and quantitative data as complements
Quite often, the same market research team employs both qualitative and quantitative approaches. The two approaches frequently operate in tandem or in iterations.
For example, a market researcher looking to establish best sales and marketing practices might first look at the purchase history of all their customers. From there, they might interview their most loyal customers -- as determined by total purchases, longest streak of quarters of consistent purchasing, etc. -- to get at how and why they have been loyal customers.
After coding for frequent themes in the loyal customer interviews, the market researcher might notice the majority of the interviews included the theme of superior customer service. From there, they might go back into data from their customer service platform and pull the response times by customers, as well as a measure of their brand loyalty. They might be able to correlate fast response times with higher loyalty, thus establishing that fast response time is a key factor in establishing and maintaining loyal customers.
Qualitative data analysis
Qualitative data analysis can be characterized as being either deductive or inductive. In a deductive approach, the analyst begins with a question and examines the data subjectively in context of the question. In an inductive approach, the analyst has no agenda. The analyst simply examines the data to look for patterns. Generally speaking, an inductive approach takes longer than a deductive approach.
The deductive approach is equivalent to using the scientific method. A frequent inductive method is called grounded theory. This simply means the researcher is grounded in the data they have in front of them, rather than approaching the data with a preexisting theory or research question in mind.
Sharing qualitative analysis
Whereas conclusions drawn from quantitative data analysis are easily understood through the universal framework of mathematics, researchers working with qualitative data must be more creative to share their findings. Popular tools for sharing qualitative data include the following:
- Word clouds. These are used for visually emphasizing or deemphasizing the frequency of various outcomes in a data sample.
- Timelines. These emphasize significant events or milestones in a data sample in relationship to the passing of time.
- Graph databases. A graph database graphically illustrates the relationships between data elements. Like word clouds, graph databases -- which may also be referred to as concept maps -- can make qualitative data easier to understand by using size, color and placement to emphasize or deemphasize the value of data elements within the sample.
- Infographics. An infographic uses charts, illustrations and minimal text to present findings visually in a story form that can be easily understood.
Traditional quantitative visualizations, such as histograms, or bar charts, are also frequently used once coding has been completed and there are frequency counts established for the tags or themes. Qualitative data is also frequently shared in example, quote or clip form to support conclusions that came from quantitative analysis.
Pros and cons of qualitative data
Observational and content analysis methods help researchers avoid the Hawthorne effect and collect data that is accurate to the actual experience. Including qualitative data in reporting helps add color to a story one is trying to tell through data by bringing generalized conclusions into a less abstract view, with real examples from real people.
It can be very time-consuming to collect and analyze qualitative data. This is why qualitative data researchers tend to use sampling in their analysis. When small samples of data are used, however, scaling the results out to discover useful patterns can be difficult.
Quantifiable data can be put directly into a database, and analysts can use mathematical formulas and numerical calculations to analyze it. In contrast, qualitative data must be categorized through descriptive parameters, such as traits or physical characteristics, before it can be statistically examined for patterns or meaning.
While quantitative data analysis can easily be performed by citizen analysts using software tools like spreadsheets, qualitative data analysis relies on the researcher's skills and experience to create parameters from a small sampling through which larger data sets can be examined.
Analytical coding
The process of categorizing qualitative data is called coding. Coding allows the research to organize qualitative data, using parameters aligned with the questions the researcher seeks to answer if taking a deductive approach. If inductive, the researcher more or less goes in blind and looks for themes to emerge as they process the data -- e.g., read through transcripts or listen to recordings. This tends to be even more time-consuming than going in with a question, because it takes many passes through the data to refine the themes that are salient.
The process of assigning codes to repeated patterns and grouping the codes into a hierarchy to prepare it for statistical analysis is called grounding the data.
In many cases, the coding process is recursive, rather than linear. For example, an analyst might go through the data first for a high-level theme, like customer satisfaction. As the researcher digs in, they will usually narrow their focus, subdividing the data into subthemes of positive customer satisfaction and negative customer satisfaction.
Qualitative analysis tools
Qualitative data analysis (QDA) relies on both analog and digital tools for systematizing, organizing and analyzing non-numeric data.
Traditional analog tools for qualitative analysis include the following:
- SWOT analysis (strengths, weaknesses, opportunities and threats analysis). This is a framework for identifying and analyzing the internal and external factors that can have an impact on the viability of a project, product, place or person. SWOT analysis is useful to provide a snapshot for understanding the qualitative dynamics that affect success.
- Porter's five forces. This is a framework developed by Harvard professor Michael E. Porter to improve SWOT analysis by identifying and analyzing the internal and external factors that can have an impact on success.
Increasingly, computer-assisted qualitative data analysis software (QDAS) can help analysts shorten the time it takes to collect and analyze qualitative data. Typically, QDAS includes features such as the following:
- Transcription analysis.
- Coding for sentiment analysis and text interpretation.
- Recursive abstraction.
Qualitative data analysis vendors
Software programs for qualitative analysis were first marketed in the mid-1980s. Today, qualitative data analysis software is an established market. Key players include the following:
- MAXQDA.
- Smartlook.
- NVivo.
- ATLAS.ti.
- Quirkos.
- Dedoose.
- QDA Miner.
- WebQDA.
- Raven's Eye.
- HyperRESEARCH.
- Dovetail.